Building an Agentic AI application is an exhilarating experience. You watch your LLM break down a complex user query, plan a series of actions, search a vector database, execute Python code, and synthesize an answer. It feels like magic—until it breaks.
When an agent enters an infinite loop, hallucinates a tool input, or simply takes too long to respond, standard debugging tools fail you. Reading through JSON logs of non-deterministic text outputs is a nightmare. According to a 2024 survey by LangChain and HumanLoop, 58% of developers cite “debugging and evaluation” as the biggest bottleneck in moving LLM applications from prototype to production.
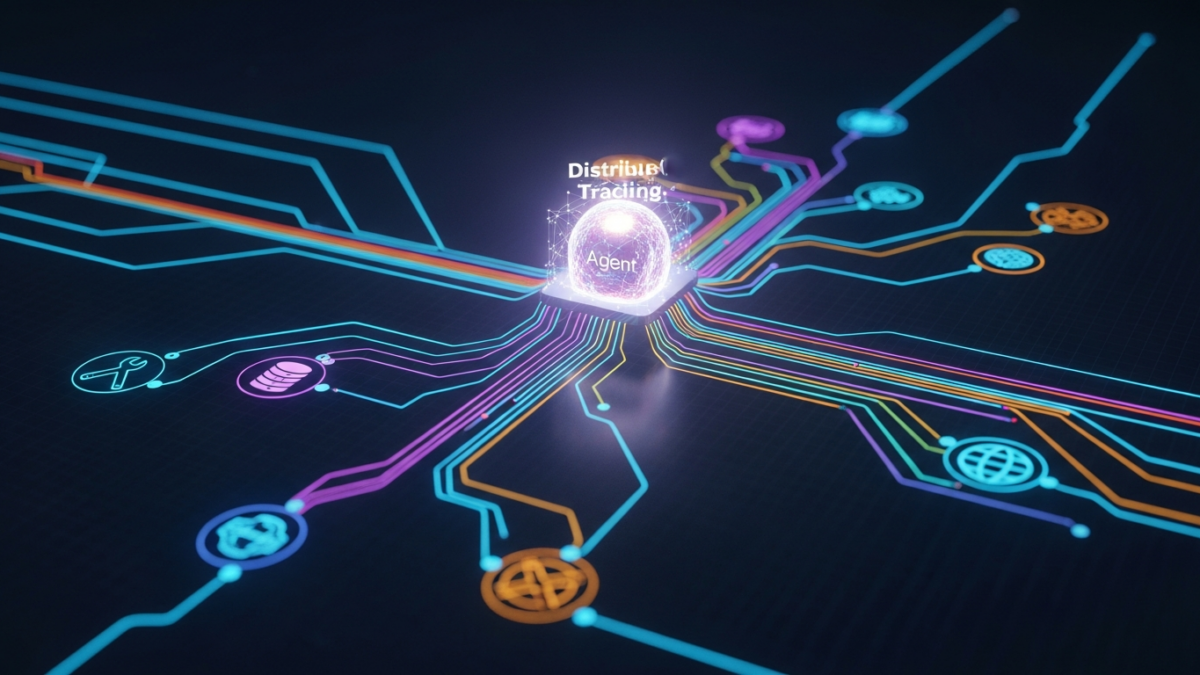
We need a better way. We need to treat Agentic AI not just as a model, but as a distributed system. This is where OpenTelemetry (OTel) comes in.
The “Black Box” Problem in Agentic Workflows
To understand why we need tracing, we have to understand what makes Agentic AI unique. Unlike a standard chatbot that maintains a simple conversation history, an agent is autonomous. It follows a loop: Observe, Reason, Act. A single user request—such as “Book a flight to the nearest AWS conference”—might trigger ten sequential LLM calls, five database lookups, and three external API requests.
This complexity creates a massive visibility gap. If the agent books the wrong date, was the reasoning flawed? Did the flight search API return malformed data? Did the vector database retrieve irrelevant context?
Standard logging struggles here. `print` statements give you a linear timeline, but they fail to capture the causal relationships between steps. Furthermore, agents suffer from unique failure modes. Traceloop research indicates that multi-step agents see failure rates 3x higher than single-turn LLM apps. These failures often stem from “looping” errors, where the agent gets stuck in a reasoning cycle, or “tool failures,” where the agent hallucinates parameters for an API call.
Without deep visibility, these issues are not just annoying; they are expensive. Unobserved agent loops can increase API costs by 400% in edge cases. To move agents to production, we need to turn that black box into a glass house.
Mapping Distributed Tracing to Agent Reasoning
Fortunately, the cloud-native world has already solved this problem for microservices. Distributed tracing allows engineers to track a request as it travels through different services. We can apply this exact mental model to Agentic AI.
In this context:
- The Trace is the User Task: A Trace ID represents the entire lifecycle of the user’s request, from the initial prompt to the final answer.
- The Span is the Step: Every distinct operation creates a Span. The LLM inference is a span. The vector database query is a span. The execution of a Python script is a span.
By nesting these spans, we build a hierarchy. The “Flight Booking Agent” is the root span. Inside it, we find child spans for “Reasoning,” “Search Flights,” and “Reserve Seat.” If the “Reserve Seat” span throws an error or takes 5 seconds, it is immediately visible in the context of the parent task.
Visualizing this in a tool like Grafana Tempo or Jaeger creates a “Waterfall view.” You can see exactly where the agent got stuck. Did it spend 4 seconds thinking (inference latency) or 4 seconds waiting for the weather API (tool latency)? This distinction is critical for optimization.
OpenTelemetry Semantic Conventions for GenAI
OpenTelemetry isn’t just a protocol; it’s a standard. As of early 2024, the OpenTelemetry community has officially released “Semantic Conventions for Generative AI systems.” This is a massive step forward for the industry.
Before these standards, every AI observability tool had its own proprietary schema. Datadog had one way of logging prompts; LangSmith had another. This created vendor lock-in. The new `gen_ai` system attributes define a common language, ensuring that if you instrument your code once with OTel, you can send that data to Arize, Datadog, or an open-source dashboard like Grafana without changing your code.
To instrument an agent effectively, you should focus on tracking these key attributes:
gen_ai.prompt: The full input sent to the model. Essential for debugging context issues.gen_ai.completion: The model’s output. Critical for evaluating quality.gen_ai.model.name: Which model was used (e.g., GPT-4, Llama 3). This helps track costs and latency per model tier.gen_ai.token.count: The number of tokens used. This is the raw material for calculating exact API costs.
Understanding Span Kinds is also vital. You should distinguish between llm spans (which represent the inference time of the model) and tool spans (which represent the execution of external functions like database lookups or HTTP requests). Separating these allows you to calculate the ratio of “thinking time” versus “acting time.”
Implementation Strategy: Instrumenting Your Agents
So, how do we actually implement this? If you are building in Python, the ecosystem is rapidly maturing. You can choose between auto-instrumentation and manual instrumentation.
Auto-Instrumentation is the path of least resistance. Libraries like `opentelemetry-instrumentation-openai` can automatically wrap your API calls. You don’t need to change your application logic; the library intercepts the call to the LLM provider, creates the span, records the prompt and response, and sends it to your OTel collector.
However, Agentic AI often involves custom logic—custom tools or specific reasoning steps that auto-instrumentation might miss. This is where Manual Instrumentation shines.
Here is a pseudo-code example of how to wrap a custom agent step using the OpenTelemetry Python SDK:
from opentelemetry import trace

tracer = trace.get_tracer(__name__)

def execute_tool_logic(query):
    # Start a new span for this specific action
    with tracer.start_as_current_span("agent.tool_use") as span:
        # Set standard attributes to identify the tool
        span.set_attribute("tool.name", "weather_api")
        span.set_attribute("tool.input", query)

        try:
            # Execute the actual tool logic
            result = call_weather_api(query)

            # Record the successful output
            span.set_attribute("tool.output", result)
            span.set_status(trace.StatusCode.OK)
            return result
        except Exception as e:
            # Record the error so we can see it in traces
            span.record_exception(e)
            span.set_status(trace.Status(trace.StatusCode.ERROR, str(e)))
            raise
A critical technical detail is Context Propagation. Agents are highly asynchronous. An agent might plan a step, invoke a tool via a callback, and receive the result later. You must ensure the Trace Context is passed through these async boundaries. If the context is lost, the tool execution will appear as an orphaned trace, disconnected from the reasoning step that triggered it.
Advanced Observability: Evaluating “Reasoning Quality”
Tracing is usually associated with performance—finding the slow span. But for AI, tracing is also about correctness. A fast trace that produces a hallucination is still a failure.
This leads us to Evaluation Spans. In a modern workflow, you don’t just trace the execution; you trace the evaluation. After a trace is completed, an automated evaluator (like RAGAS or an LLM-as-a-Judge) can analyze the span data. It checks if the answer matches the ground truth or if the retrieved context was relevant.
The result of this evaluation—a score or a pass/fail grade—is then attached back to the original trace as a new span or attribute. This allows you to filter traces not just by error status, but by “reasoning quality.” You can search for “all traces where the agent used the calculator tool and scored less than 0.7 on accuracy.”
This feedback loop connects your OTel data to specialized LLM UIs. While general-purpose APM tools like Grafana are great for infrastructure health, specialized tools like LangSmith or Arize Phoenix are optimized for inspecting the textual content of the spans. Because we use the OTel standard, we can export to both simultaneously.
Production Readiness Checklist
Before you ship your Agentic AI to production, consider these final observability requirements to ensure your system is robust and secure.
1. Implement Smart Sampling
Tracing every single token of every LLM call will overwhelm your backend and skyrocket your storage costs. Implement dynamic head-based sampling. For example, always trace 100% of errors or traces that involve specific tools (like payment processing), but only sample 10% of standard “happy path” conversations. This keeps costs manageable while ensuring you don’t miss critical failures.
2. PII Redaction is Non-Negotiable
One of the biggest risks in LLM observability is logging sensitive user data. If you are logging the `gen_ai.prompt` attribute, you might be logging passwords, addresses, or medical history. You must use a `SpanProcessor` in your OTel pipeline to scrub or hash PII before the data leaves your infrastructure. Never send raw PII to a third-party observability vendor.
3. Monitor Costs via Metrics
Since you are already tracking `gen_ai.token.count` in your spans, you can easily convert this into metrics. Configure your OTel metrics pipeline to calculate the cost per user session. If a specific agent flow starts averaging $2.00 per session due to looping logic, you want an alert to fire immediately, not when the bill arrives at the end of the month.
Key Takeaways
- Treat Agentic AI as a distributed system where the user request is a Trace and every reasoning step is a Span.
- Utilize OpenTelemetry’s new GenAI Semantic Conventions to standardize your attributes and avoid vendor lock-in.
- Combine auto-instrumentation for standard calls with manual instrumentation for custom tool logic.
- Use Evaluation Spans to attach quality scores to your traces, enabling you to debug reasoning, not just latency.
- Always implement sampling and PII redaction to keep costs down and data secure.
The era of “black box” AI is ending. By applying the rigor of distributed tracing to the messy reality of Agentic workflows, we can move these powerful systems from fascinating prototypes to reliable production products.
Ready to instrument your first agent? Join the RodyTech newsletter for more deep dives into AI infrastructure and developer tools.
Get the next deep dive before it hits search.
RodyTech publishes practical writing on AI systems, infrastructure, and software that teams can actually ship. Subscribe for new posts without waiting for an algorithm to surface them.
- One useful email when a new article is worth your time
- Hands-on notes from real builds, deployments, and ops work
- No generic growth funnel copy, just the writing


No comments yet