

In this article
Why We Self-Hosted Langfuse: The Operational Reality for Small Teams
If you are a team of three to ten engineers, the standard SaaS observability model is actively working against you. The trap is not just the cost; it is the architecture. Managed platforms often impose per-seat fees that scale linearly with headcount, creating a financial drag that feels arbitrary when you are trying to ship features. More insidiously, they encourage proprietary SDKs that lock you into a specific vendor’s data model. When your LLM integration becomes brittle or your costs spiral, you are not just paying a premium; you are paying for the inability to move.
Buying more software is rarely the solution for teams with limited engineering budgets. Instead, the pragmatic alternative is to own the stack. By self-hosting, you control your data residency, eliminate recurring per-request costs, and retain the ability to swap components without rewriting your core instrumentation. This is not about being cheap; it is about maintaining the agility to pivot your technical strategy without being held hostage by enterprise sales gates or vendor lock-in.
The Core Strategy: Langfuse + OpenTelemetry
For tiny teams building with LLMs, the combination of Langfuse and OpenTelemetry (OTel) offers a production-grade foundation on a shoestring. Langfuse is the ideal choice for LLM lifecycle management because it is open source under the MIT license, allowing unrestricted self-hosting. It provides essential primitives like a playground for testing prompts and built-in evaluation frameworks, which are critical for iterating on model performance without external dependencies.
The power of this strategy lies in vendor-neutral instrumentation via OpenTelemetry. By standardizing on OTel, you decouple your application code from the observability backend. This means you can pipe traces into Langfuse today and switch to a different backend tomorrow without rewriting your instrumentation code. This combination builds a resilient stack that scales with your engineering capacity, not your vendor’s pricing tier.
Deploying for Scale: Docker Compose to Production
Deploying this stack requires understanding the infrastructure reality. Langfuse’s self-hosted version uses the exact same infrastructure that powers its managed cloud offering, which means it is robust but not trivial to run. You are not just deploying a single application; you are managing a distributed system.
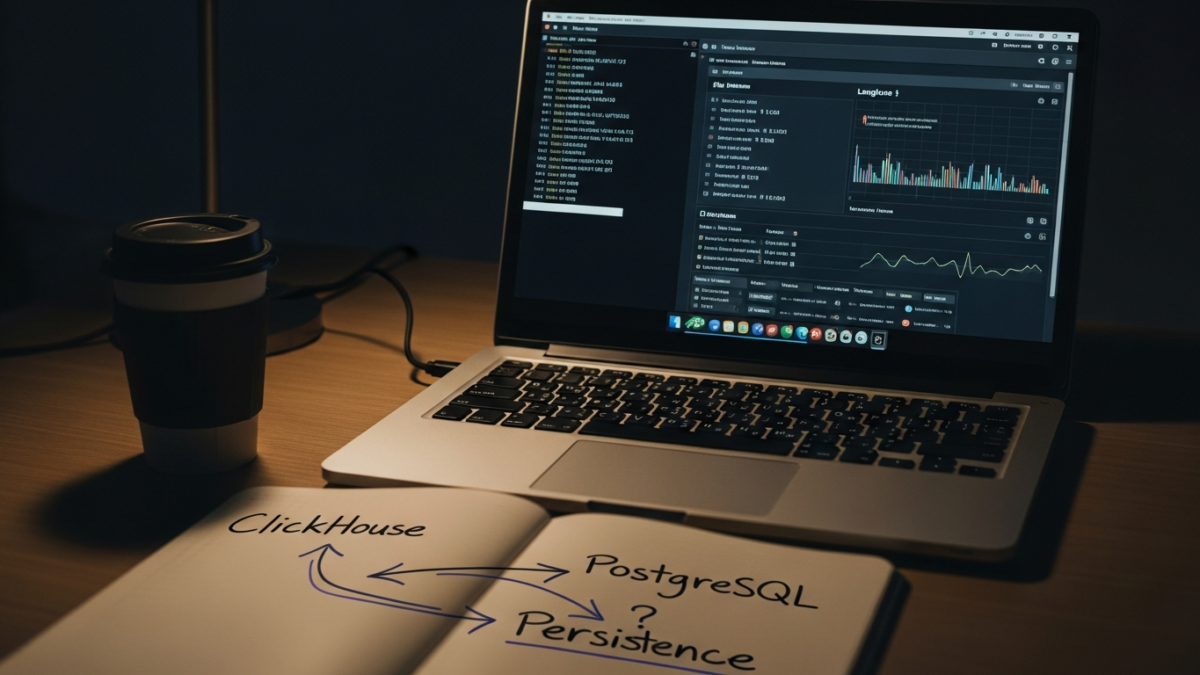
Starting simple, you can deploy Langfuse via Docker Compose for low-scale testing. This is sufficient for early-stage development and validation. However, as you move toward production, you must account for the complexity of the underlying services. Self-hosting Langfuse requires running at least five services: ClickHouse for time-series data, PostgreSQL for relational metadata, Redis for caching and session management, and the Langfuse application server itself.
The tradeoff here is operational overhead versus financial cost. You save money on SaaS fees, but you pay in engineering time. For teams ready to scale up, moving to Kubernetes or Terraform-based deployments is necessary for high availability. This shift introduces complexity in managing stateful sets and persistent volumes, but it provides the reliability required for production workloads. The decision to self-host is a decision to accept this operational burden in exchange for control and cost predictability.
Connecting the Dots: OTLP Integration
The integration between Langfuse and OpenTelemetry is the linchpin of this strategy. Langfuse exposes an OpenTelemetry Protocol (OTLP) endpoint at /api/public/otel, enabling standard OpenTelemetry libraries to pipe data directly into the instance. This allows you to use standard libraries, such as OpenLLMetry, to instrument your application without relying on Langfuse-specific SDKs for the heavy lifting of trace collection.
Configuring Langfuse to send its own internal traces to your collector is done via environment variables. You can set OTEL_EXPORTER_OTLP_ENDPOINT to point to your collector and OTEL_TRACE_SAMPLING_RATIO to control the volume of data ingested. This configuration ensures that Langfuse is not just a passive recipient of data but an active participant in your observability ecosystem.
The long-term benefit of this approach is flexibility. If you decide to switch backends, you only need to change the exporter configuration. Your application code remains clean and focused on business logic, not observability plumbing. This is a critical advantage for tiny teams who cannot afford to spend weeks refactoring code due to a vendor change.
Building Useful Alerts and Avoiding Noise
Observability is useless if it generates noise. For tiny teams, the goal is to focus on business-critical metrics rather than comprehensive logging. You do not need to capture every single token generation event if it does not impact user experience or cost. Instead, set up alerts that provide actionable insights.
A useful alert wakes you up because something is broken or costing too much, not because a metric fluctuated within normal bounds. For example, alert on latency p99 spikes that exceed your service level objectives, or on cost anomalies that deviate significantly from your baseline. Avoid alerts on low-level infrastructure metrics that can be monitored by your hosting provider.
The recommendation is to start simple. Instrument your application with OTel, send the data to Langfuse, and define a small set of high-signal alerts. As you grow, you can refine these alerts and add more granular tracing. The key is to maintain a feedback loop where your observability data directly informs your engineering priorities, rather than becoming a black box of metrics that no one checks.

No comments yet