If you’ve ever deployed a LangChain agent or an AutoGPT-style workflow into production, you know the distinct feeling of dread that accompanies a “silent failure.” In traditional software, a 500 error or a stack trace tells you exactly where things broke. In the world of Generative AI, your code returns a 200 OK, but the output is completely wrong—or worse, your agent enters an infinite logic loop burning through your OpenAI credits.
Welcome to the age of the probabilistic stack. We are moving from deterministic programming (if X, then Y) to probabilistic reasoning (if X, then probably Y, depending on the context). According to a recent survey by Traceloop, 73% of AI developers report that debugging LLM applications is significantly harder than traditional software. The logic is non-deterministic, the state is complex, and the cost of failure is high.
This is where the old guard of Application Performance Monitoring (APM) starts to falter. Traditional APM is great for measuring latency and CPU usage, but it is blind to semantic correctness. It doesn’t know if your LLM hallucinated a fact or if an agent misunderstood a tool’s output. To tame this chaos, we need a new approach centered on LLM Observability, and the industry is coalescing around a surprising hero: OpenTelemetry (OTel).
The Probabilistic Stack Problem
Before diving into the solution, we have to understand the nature of the beast. Traditional debugging relies on reproducibility. You set a breakpoint, inspect the variables, and the state is exactly the same every time.
With LLMs, reproducibility is a luxury. If you send the same prompt to GPT-4 twice, you might get two different token streams. Now, imagine complicating this with an Agentic Workflow. A single user query doesn’t just hit one API endpoint. It triggers a chain: Thought → Action → Observation → Thought.
The Agent (the orchestrator) decides it needs to query a database. It calls a tool. The tool returns data. The Agent reasons about that data and decides to call another tool. If the Agent makes a slight error in parsing the tool’s output, it might retry indefinitely. Traditional logging will just show you 50 API calls to the weather service. It won’t easily show you why the Agent thought it needed to call them 50 times.
We are dealing with a shift from code execution to intent execution. To debug this, we need to trace the flow of thought, not just the flow of bytes.
OpenTelemetry as the Universal Translator
You might be wondering: why not just use the native debugging tools provided by platforms like LangSmith or OpenAI’s built-in telemetry? The answer lies in vendor lock-in.
The GenAI landscape moves fast. Today you are using OpenAI; tomorrow you might switch to Llama 3 running on your own cluster. If your observability is tied to a proprietary SDK, migrating providers means rewriting your instrumentation.
Enter OpenTelemetry. Already the second most active project in the Cloud Native Computing Foundation (after Kubernetes), OTel has seen a massive 300% increase in adoption for AI/ML use cases in the last year. It provides a vendor-agnostic standard for telemetry data.
By utilizing OTel, you standardize on three key signals:
- Traces: The primary signal for LLMs. Traces connect the dots between the user request, the agent’s reasoning, and the downstream tool calls.
- Metrics: Aggregated data points. In the AI world, this means tracking token usage, latency per generation, and cost estimation.
- Logs: The raw data—the prompts and completions themselves.
With OTel, you can switch your LLM provider without breaking your observability pipeline. The data remains consistent regardless of who is generating the tokens.
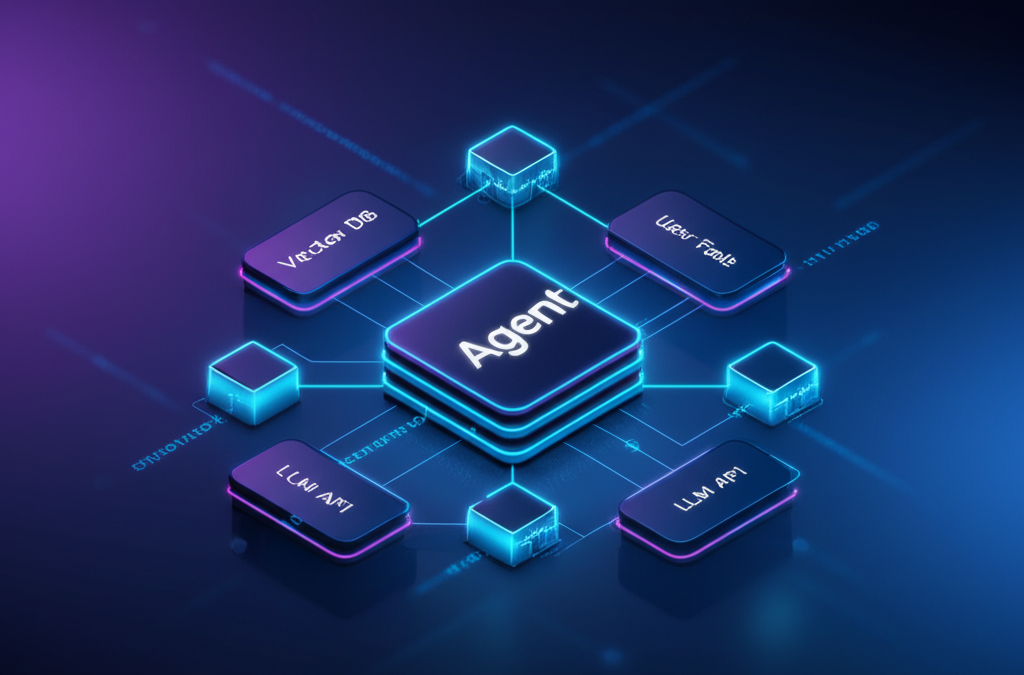
The Anatomy of an LLM Trace
To effectively debug an agent, you need to understand the hierarchy of a trace. OTel structures this using a parent-child relationship called a Span. In a multi-step workflow, the span hierarchy tells the story of the user’s intent.
A typical production trace for an AI Agent looks like this:
- Root Span (The User Request): This represents the initial query. It contains the user ID and the initial prompt.
- Child Span 1 (Agent Reasoning): The Agent processes the input. This span captures the “Chain of Thought” or the specific route the agent took (e.g., deciding to use a SQL tool vs. a Search tool).
- Grandchild Span A (Vector DB Retrieval): If the agent uses RAG (Retrieval-Augmented Generation), it queries a database. This span measures the retrieval latency and the number of documents fetched.
- Grandchild Span B (LLM Generation Call): The actual call to the model (e.g., OpenAI or Anthropic). This is where we capture the prompt and the final completion.
The magic of OpenTelemetry for AI lies in its Semantic Conventions. As of early 2024, the OTel community has standardized specific attributes for GenAI. When you instrument your code, you attach these keys to your spans:
llm.model.name: Which model was called (e.g.,gpt-4-turbo)?llm.prompt_messages: The full array of input messages sent to the model.llm.completion_messages: The output received.llm.token_count.total: Crucial for calculating cost.gen_ai.system: The vendor (openai,hugging_face, etc.).
By populating these attributes, you turn a generic trace into a rich context-aware audit trail. You aren’t just seeing that a function took 2 seconds; you are seeing exactly what question was asked and how the model answered.
Debugging the “Edge Cases” in Agent Workflows
Once you have this data flowing into a backend like Grafana Tempo or Jaeger, you can start tackling the specific nightmares of Agentic AI.
Scenario A: Tool Failure Loops
One of the most expensive issues in production is the “Tool Loop.” An agent attempts to call a weather API, receives a 404 or a malformed JSON response, and doesn’t know how to handle the error. Instead of stopping, it interprets the error as a reason to try again. And again. Data from LangChain suggests that 15-20% of production token usage is wasted on these retry loops.
With OTel, you can visualize this instantly. You will see a span tree that repeats the same tool_call span 50 times in a loop. You can inspect the input parameters of the 50th call to see that the Agent is passing the exact same arguments as the 1st call. This visibility allows you to implement better guardrails or timeout mechanisms in your agent code.
Scenario B: Context Drift
In long-running conversations, agents tend to drift away from the original context. You can use span.links in OpenTelemetry to correlate a current generation back to the original root span. If you notice that the semantic similarity between the Root Prompt and the 10th generation is low, you have identified context drift.
Technique: Baggage Propagation
A specific implementation tip for distributed AI workflows is Baggage. In OpenTelemetry, Baggage allows you to pass key-value pairs across service boundaries asynchronously. You can inject the userId or tenantId into the root span and have it automatically propagate to every LLM call and Vector DB query, even if those calls happen in different microservices. This is vital for debugging security issues or rate-limiting bugs where you need to trace exactly *who* triggered a specific runaway cost anomaly.
Implementation Guide: Instrumenting an Agent
Let’s look at how to actually implement this. We’ll use Python and the OpenTelemetry SDK to instrument a hypothetical LLM call.
First, ensure you have the necessary packages installed:
pip install opentelemetry-api opentelemetry-sdk opentelemetry-auto-instrumentationHere is a conceptual example of how to manually create a span that adheres to the new GenAI semantic conventions:
from opentelemetry import trace
from opentelemetry.sdk.trace import TracerProvider
from opentelemetry.sdk.trace.export import BatchSpanProcessor, ConsoleSpanExporter

# Setup OTel
trace.set_tracer_provider(TracerProvider())
trace.get_tracer_provider().add_span_processor(BatchSpanProcessor(ConsoleSpanExporter()))
tracer = trace.get_tracer(__name__)

def run_llm_agent(user_prompt):
    # Create the Root Span for the Agent Workflow
    with tracer.start_as_current_span("agent_workflow") as parent:
        parent.set_attribute("user.id", "user_123")

        # Simulate a Retrieval Step (Child Span)
        with tracer.start_as_current_span("vector_db_retrieval", parent=parent) as retrieval_span:
            # ... logic to query DB ...
            retrieval_span.set_attribute("db.query", "semantic search for python docs")
            retrieval_span.set_attribute("db.results.count", 4)

        # The LLM Generation Span (Child Span)
        with tracer.start_as_current_span("llm_generation", parent=parent) as llm_span:
            # Adhering to GenAI Semantic Conventions
            llm_span.set_attribute("gen_ai.system", "openai")
            llm_span.set_attribute("llm.model.name", "gpt-4")
            llm_span.set_attribute("llm.prompt_messages", [user_prompt])

            # Simulate the call
            completion = "Here is the python code you requested..."

            llm_span.set_attribute("llm.completion_messages", [completion])
            llm_span.set_attribute("llm.token_count.total", 150)

if __name__ == "__main__":
    run_llm_agent("Write a hello world script in Python")
In a real-world scenario, you would likely use the OTLPSpanExporter to send this data to a Collector (like Grafana Agent or OTEL Collector) rather than printing to the console. This Collector would then forward the traces to a visualization backend like Grafana Tempo, allowing you to see the waterfall charts of your agent’s execution.
From Debugging to Evaluation
Observability isn’t just about putting out fires; it is about building a better fire. Once you have a robust collection of traces, you transition from debugging to Evaluation.
Your stored traces form a “Golden Dataset”—a record of real user interactions and your agent’s responses. You can use this dataset to run automated grading scripts. This is often called “LLM-as-a-judge.” You take a stored trace, feed the prompt into a new version of your model, and use a stronger LLM (like GPT-4) to grade if the new response is more accurate than the old one.
Without observability, you are flying blind. With OpenTelemetry, you have the data required to iterate confidently. Gartner predicts that by 2028, 33% of enterprise software will include agentic AI workflows. As we move from prototypes to production-grade agents, OpenTelemetry will be the bridge that connects the black-box magic of AI with the rigorous reliability standards of modern engineering.
Key Takeaways
- Shift Your Mindset: Move from deterministic debugging to observability focused on intent and semantic correctness.
- Adopt Standards: Use OpenTelemetry to avoid vendor lock-in and ensure your telemetry data survives model swaps.
- Structure Your Traces: Organize spans hierarchically (Request → Agent Reasoning → Tool Call) to understand the execution flow.
- Capture Metadata: Utilize GenAI semantic conventions (model name, token counts) to track costs and performance.
- Use the Data: Don’t just watch traces; use them to create golden datasets for automated evaluation and continuous improvement.
Ready to stop guessing and start tracing? Dive into the OpenTelemetry documentation today and start instrumenting your agents. Your future self (and your AWS bill) will thank you.
No comments yet