

In this article
Internal Dashboards That Survive Reboots: Health Checks, Process Managers, and Boring Recovery
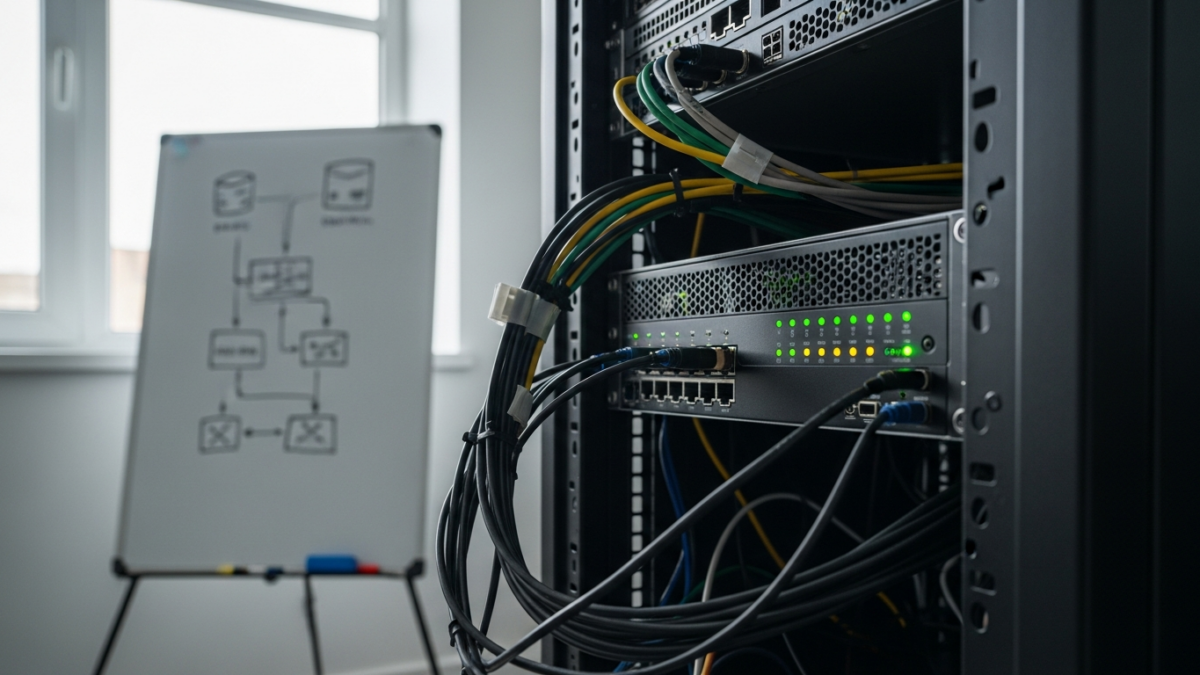
Most internal dashboards are lying to you.
They look functional in staging. They render charts correctly. They connect to the database without throwing a 500 error. But the moment the server reboots—whether due to a kernel update, a power flicker, or a simple sudo reboot—the dashboard becomes a static, empty shell. The frontend loads, but the data pipeline is dead. The monitoring process that feeds it never started. The alerting service that keeps the system honest is silent.
We obsess over the visualization layer because it is visible. We tweak CSS, adjust chart libraries, and argue over color palettes. But for an operator building production-ready infrastructure, the visualization is the least interesting part of the equation. The critical layer is the recovery layer. If your internal tools cannot survive a reboot without manual intervention, they are not tools; they are liabilities.
The transition from homelab tinkering to production readiness is defined by one shift: moving from “does it work when I run it?” to “does it work when I forget it?” This requires a boring, unsexy commitment to health checks, process managers, and deterministic recovery strategies.
The Silent Failure of Internal Dashboards
In the homelab phase, we are used to manual control. We start the services. We keep the terminal open. We watch the logs. When the server goes down, we notice because we are usually sitting in front of it. But in a production or semi-production environment, the dashboard is expected to be always-on.
The failure mode here is silent. The server comes back up. The network stack initializes. The database is ready. But the application process that powers the dashboard was not configured to auto-start. Or worse, it started, crashed immediately due to a missing environment variable, and died without leaving a trace that is easy to find.
This is the difference between a tinkering mindset and a production-ready mindset. Tinkering assumes human presence. Production assumes human absence.
When we build internal dashboards for reliability, we must accept that the infrastructure will fail. Reboots will happen. Dependencies will timeout. Memory leaks will occur. The goal is not to prevent these events, but to ensure the dashboard recovers from them automatically. If you have to SSH into a server to restart a dashboard after a reboot, you have failed the reliability test.
The Recovery Layer: Health Checks and Process Managers
The solution to silent failures is not more complex code; it is better orchestration. We need a recovery layer that operates independently of the dashboard’s application logic. This layer consists of two components: a process manager to keep the application alive, and health checks to verify its state.
Automating the Mundane with Systemd
On modern Linux systems, systemd is the default init system. It is the most reliable way to ensure that your dashboard processes start on reboot and restart if they crash. This is not optional. It is the baseline for any service that claims to be production-ready.
Consider the monitoring processes that feed your dashboard. If you are using a tool like healthchecks to monitor cron jobs and background tasks, the sendalerts process must be running continuously. If it crashes, you lose visibility into your infrastructure’s health. If it doesn’t start on reboot, you have a blind spot.
Defining a systemd service for these processes ensures they are managed by the OS. You configure Restart=always and RestartSec=5. This tells the system: “If this process dies, start it again in five seconds. If the server reboots, start it immediately.” This removes the need for manual intervention and ensures that the monitoring loop is always closed.
The Necessity of Persistent Monitoring
Health checks are not just for the dashboard itself; they are for the processes that support it. The healthchecks project, for example, provides an open-source service for monitoring cron jobs and background tasks. Its documentation explicitly highlights the necessity of running its core processes via a process manager like systemd.
Why? Because the value of a health check service is only as good as its uptime. If the health check service is down, you don’t know if your other services are down, or if the health check service is just blind. By ensuring the monitoring process itself is resilient, you create a trustworthy source of truth for your entire infrastructure.
Practical Tools for Resilience
There are specific tools that embody this philosophy of persistent, resilient monitoring. They are not magic; they are well-engineered solutions to the problem of process management.
PM2-Hawkeye: Persistent State
For Node.js-based dashboards, PM2 is a common process manager. However, standard PM2 configurations can sometimes lose state or fail to reconnect properly after a hard reboot. This is where PM2-Hawkeye comes in.
PM2-Hawkeye is a real-time web dashboard for managing PM2 processes. Its key feature is persistent monitoring that survives server restarts. It achieves this by storing its state in SQLite. This means that even if the server loses power, the dashboard remembers which processes it was managing and their desired states. It uses WebSocket connections for real-time updates, ensuring that the operator sees the current state of the system, not a stale snapshot.
This is a concrete example of “boring recovery.” The tool handles the complexity of state persistence and real-time communication, allowing you to focus on the metrics that matter. It provides one-click restarts and secure-by-default configurations, reducing the attack surface and the cognitive load on the operator.
Healthchecks: Robust Alerting Loops
For broader infrastructure monitoring, healthchecks offers a robust framework for cron job monitoring. It is not just a dashboard; it is a system that ensures your scheduled tasks are running. It provides alerting and reporting loops that are critical for detecting failures before they cascade.
The integration between healthchecks and systemd is key. By running the sendalerts process as a systemd service, you ensure that alerts are sent immediately when a check fails, regardless of whether the dashboard UI is accessible. This separation of concerns—monitoring logic vs. visualization—is vital for reliability.
Designing for Survival, Not Just Display
Once the recovery layer is in place, we must address the dashboard design itself. A resilient dashboard that displays useless data is still a failure.
Avoiding Dashboard Paralysis
There is a tendency in dashboard design to add more charts, more filters, and more data points. This leads to “dashboard paralysis,” where the operator is overwhelmed by data and cannot make decisions. Industry guidance suggests starting small with 5-7 critical metrics.
Focus on the metrics that indicate health and performance. Avoid vanity metrics. If a chart does not help you decide whether to restart a service or investigate a log, it is noise. Simple, effective setups are superior to complex, unused ones. The goal is actionable insights, not data deluge.
Monitoring the Monitor
The dashboard itself must be monitored. You need to track its uptime, resource usage, and response times. If the dashboard is slow or unresponsive, it is failing its primary function: providing visibility.
This requires implementing health checks for the dashboard endpoint itself. A simple HTTP check that verifies the dashboard returns a 200 OK status is a good start. More advanced checks can verify that the data being displayed is fresh. If the data is stale, the dashboard is effectively lying, even if it is technically “up.”
Shifting from ‘Pretty’ to ‘Useful’
In internal tooling, aesthetics are secondary to utility. A dashboard that is ugly but provides immediate, accurate information is valuable. A dashboard that is beautiful but requires manual intervention to refresh or restart is not.
We must reject the idea that internal tools need to be polished for end-users. They need to be robust for operators. This means prioritizing error handling, logging, and recovery over UI polish.
From Tinkering to Trust
The shift from homelab to production is not just about scale; it is about trust. You need to trust that your tools will work when you need them, even when you are not there to watch them.
Security and Monitoring
Client-ready infrastructure requires a higher standard of security and monitoring. This includes:
- Secure-by-default configurations: Tools like
PM2-Hawkeyeoffer secure-by-default settings that reduce the risk of unauthorized access. - Automated health checks: Ensuring that all critical processes are monitored and alerted on.
- Deterministic recovery: Using
systemdand process managers to ensure that services start and restart automatically.
Final Checklist for Production-Readiness
Before considering an internal dashboard production-ready, ask yourself:
- Does it survive a reboot? If the server reboots, does the dashboard start automatically?
- Does it recover from crashes? If the process crashes, does it restart automatically?
- Is the monitoring process resilient? Are the health check and alerting services themselves monitored and auto-started?
- Is the data actionable? Are the metrics displayed critical and clear?
- Is the dashboard itself monitored? Is the dashboard’s uptime and performance tracked?
If the answer to any of these is “no,” the dashboard is not ready. It is a tinkering project, not a production tool.
The path to reliability is not through complex automation or expensive enterprise software. It is through boring, reliable practices: systemd services, persistent state management, and focused metrics. By embracing these principles, we build internal tools that do not just look good, but work reliably, day after day, reboot after reboot.
Sources and further reading
- Technology Archives – RodyTech Blog
- GitHub – orangecoding/pm2-hawkeye: Real-time web dashboard for managing PM2 processes
- GitHub – healthchecks/healthchecks: Open-source cron job and background task monitoring service
- 8 Small Business Dashboard Ideas To Run Your Startup Smarter
- 5 Dashboards Every Business Needs | insightsoftware
No comments yet